
Power BI
Explore business performance with connected dashboards, interactive reports and analytics.
Overview
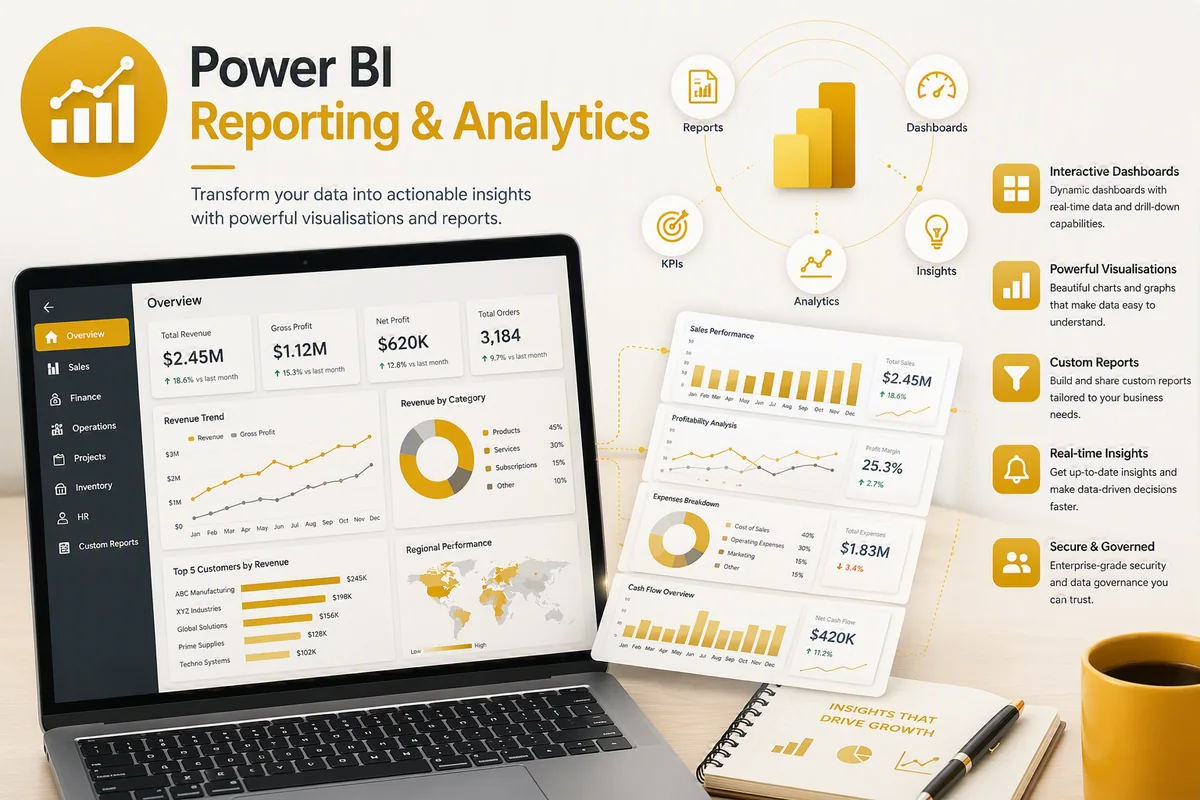
Bring business data into a clearer reporting view with Power BI. Use dashboards and interactive reports to explore performance, recognise trends and support informed decisions.
What you can manage
Dashboards
Bring key business measures together for a focused view of performance.
Interactive reports
Explore report details and the information behind the headline figures.
Trend analysis
Review changes over time to understand how your business is performing.
Is it right for your business?
For teams that need clearer reporting across their business data and want to explore performance beyond individual transactions.
When to consider a change
- Reports require repeated manual collation.
- Key measures are spread across separate documents or systems.
- Your team needs a clearer view of performance trends.
Implementation & support
A practical plan
We help identify the capabilities and connections that suit your existing software and business priorities.
Setup & training
Plan the configuration, data and training your team needs to work with the solution.
Ongoing support
Get guidance as your team settles in and your requirements evolve.